jitsi-helm
Architecture
Jitsi Meet
Components
A Jitsi Meet installation (holding one “shard”, term explained below) consists of the following different components:
webThis container represents the web frontend and is the entrypoint for each user.jicofoThis component is responsible for managing media sessions between each of the participants and the videobridge.prosodyThis is the XMPP server used for creating the MUCs (multi-user conferences).jvbThe Jitsi Videobridge is an XMPP server component that allows for multi-user video communication.
Jitsi uses the term “shard” to describe the composition that contains single containers for
web, jicofo, prosody and multiple containers of jvb running in parallel. The following diagram
depicts this setup:
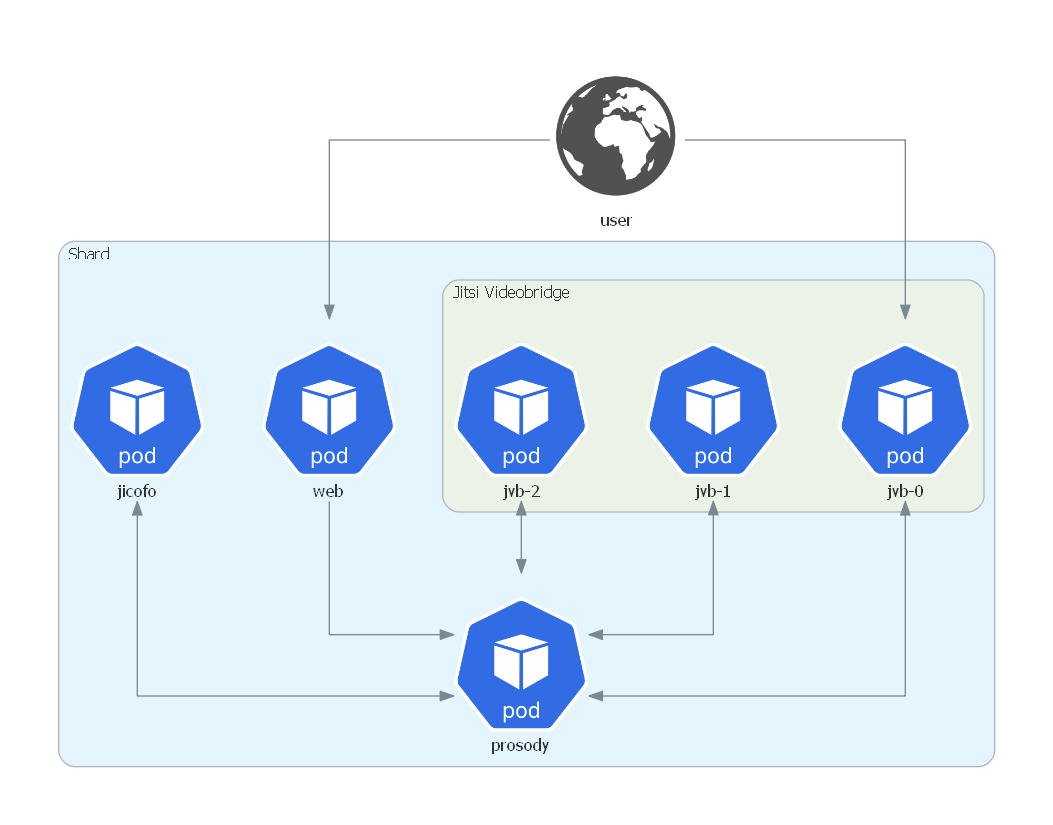
In this setup the videobridges can be scaled up and down depending on the current load
(number of video conferences and participants). The videobridge typically is the component with the highest load and
therefore the main part that needs to be scaled.
Nevertheless, the single containers (web, jicofo, prosody) are also prone to running out of resources.
This can be solved by scaling to multiple shards and we will explain this below. More information about this
topic can be found in the Scaling Jitsi Meet in the Cloud Tutorial.
Shards
A multi-shard setup has to solve the following arising difficulties:
- traffic between shards needs to be load-balanced
- participants joining an existing conference later on must be routed to the correct shard (where the conference takes place)
To achieve this, we use the following setup:
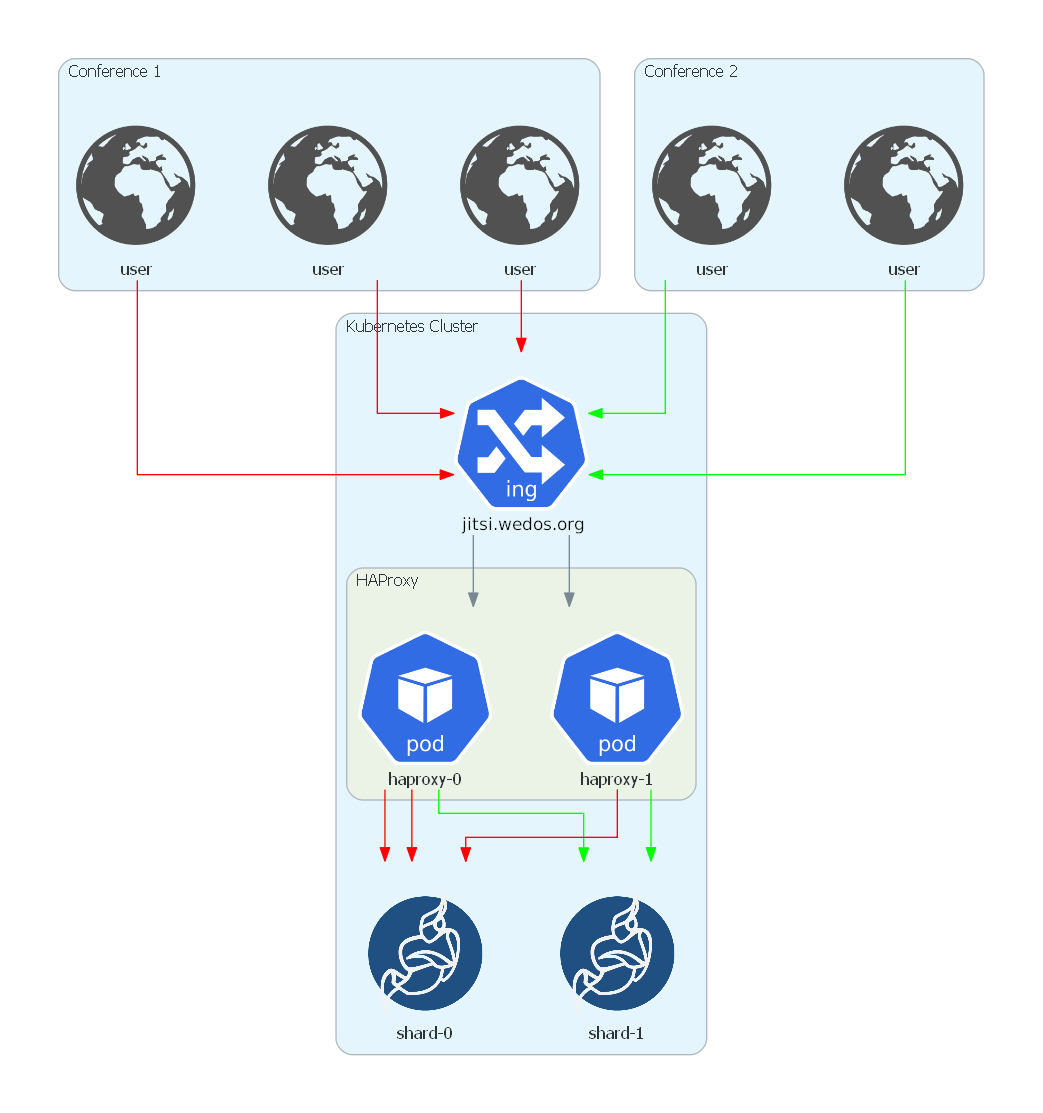
Each of the shards has the structure described in the chapter Components.
HAProxy is the central component here, as it allows the usage of stick tables.
They are used in the configuration to store the mapping between
shards and conferences. HAProxy reads the value of the URL parameter room in order to decide if the conference this
participant wants to join already exists (and hence leading the user to the correct shard) or if it is a conference which is
not known yet. In the latter case simple round-robin load-balancing between the shards is applied and HAProxy
remembers this new conference and routes all arriving participants of this conference to the correct shard.
HAProxy uses DNS service discovery for finding the existing shards. The configuration can be found at haproxy.cfg and haproxy-config.yaml.
To decrease the risk of failure a StatefulSet consisting of two HAProxy pods is used.
They are sharing the stick tables holding the shard-conference mapping by using HAProxy’s peering functionality.
By default, we are using two shards. See Adding additional shards for a detailed explanation how to add more shards.
Kubernetes Setup
The full Kubernetes architecture for the Jitsi Meet setup in this repository is depicted below:
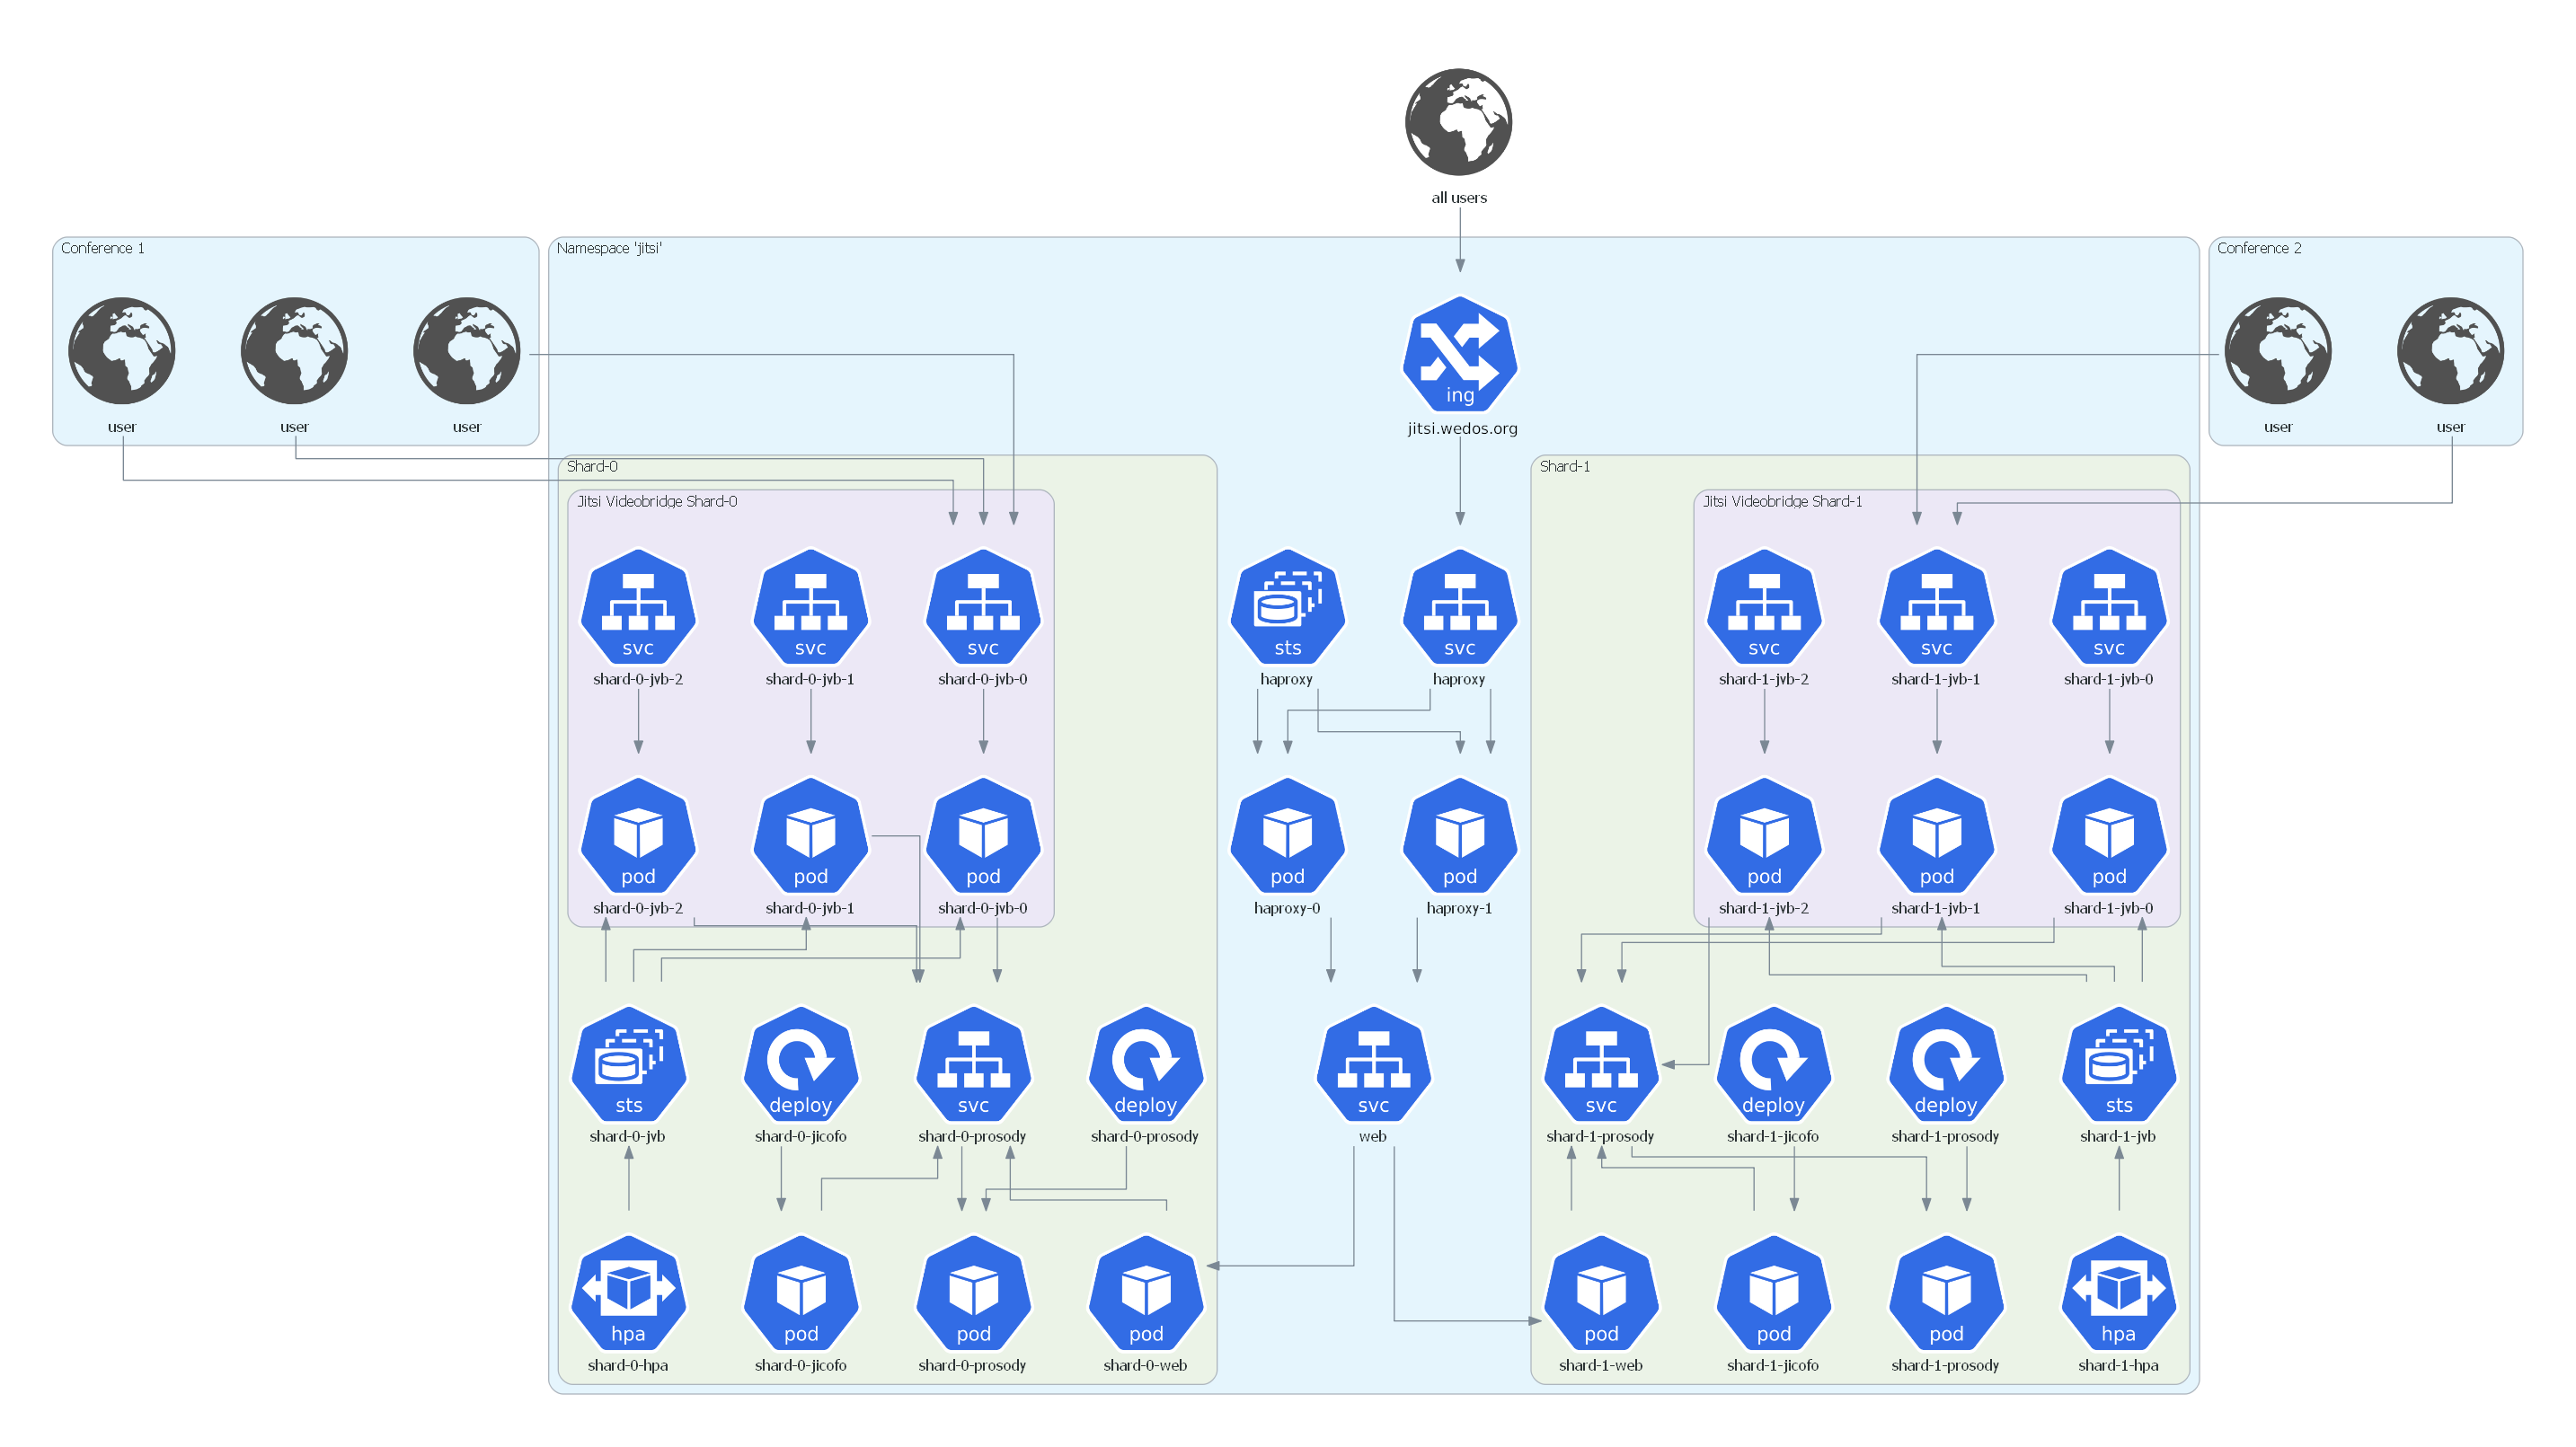
The entrypoint for every user is the ingress that is defined in Values.
At this point SSL is terminated and traffic is forwarded via HAProxy to the web service in plaintext (port 80)
which in turn exposes a web frontend inside the cluster.
The other containers, jicofo, web and prosody, which are necessary for setting up conferences, are each managed by a rolling deployment.
When a user starts a conference it is assigned to a videobridge. The video streaming happens directly between the user and this videobridge.
The videobridges are managed by a statefulset (to get predictable pod names). A horizontal pod autoscaler governs the number of running videobridges based on the average value of the network traffic transmitted to/from the pods. It is also patched in the overlays to meet the requirements in the corresponding environments.
In addition, all videobridges communicate with the prosody server via a service
of type ClusterIP.
<!–
In progress :)
Monitoring
The monitoring stack is comprised of a kube-prometheus setup that integrates
- Prometheus Operator
- Highly available Prometheus
- Highly available Alertmanager
- Prometheus node-exporter
- Prometheus Adapter for Kubernetes Metrics APIs
- kube-state-metrics
- Grafana
This stack is adapted and patched to fit the needs of the Jitsi Meet setup.
The deployment patch for Grafana adds a permanent storage to retain
users and changes made in the dashboards. In addition, Grafana is configured to serve from the subpath /grafana.
An ingress is defined to route traffic to the Grafana instance.
Again, SSL is terminated at the ingress. In order to copy the Kubernetes Secret containing the certificate for your domain from namespace jitsi to the monitoring namespace, the kubernetes-reflector is used.
A role and a role binding to let Prometheus monitor the jitsi namespace is defined in
prometheus-roleBindingSpecificNamespaces.yaml and
prometheus-roleSpecificNamespaces.yaml respectively.
Prometheus also gets adapted by an environment specific patch that adjusts CPU/memory requests and adds a persistent volume.
Furthermore, metrics-server is used to aggregate resource usage data.
Videobridge monitoring
The videobridge pods mentioned above have a sidecar container deployed that gathers metrics about the videobridge and
exposes them via a Rest endpoint. This endpoint is scraped by Prometheus based on the definition of a
PodMonitor available by the
Prometheus Operator. In folder Default of Grafana, you will find a dashboard for the current state of your Jitsi-installation.
Monitoring of other components
Stats of Prosody (using an additional add-on in a configmap) and HAProxy are also gathered by Prometheus and can hence be used for monitoring. Similar to the videobridges, PodMonitors are defined for them. –>
Adding additional shards
In order to add an additional shard, follow these steps:
- Change value of
shardCountin Values - Run
helm upgrade jitsi ./from the folder of the chart